Landfill Diversion Rate: Calculate and Improve It
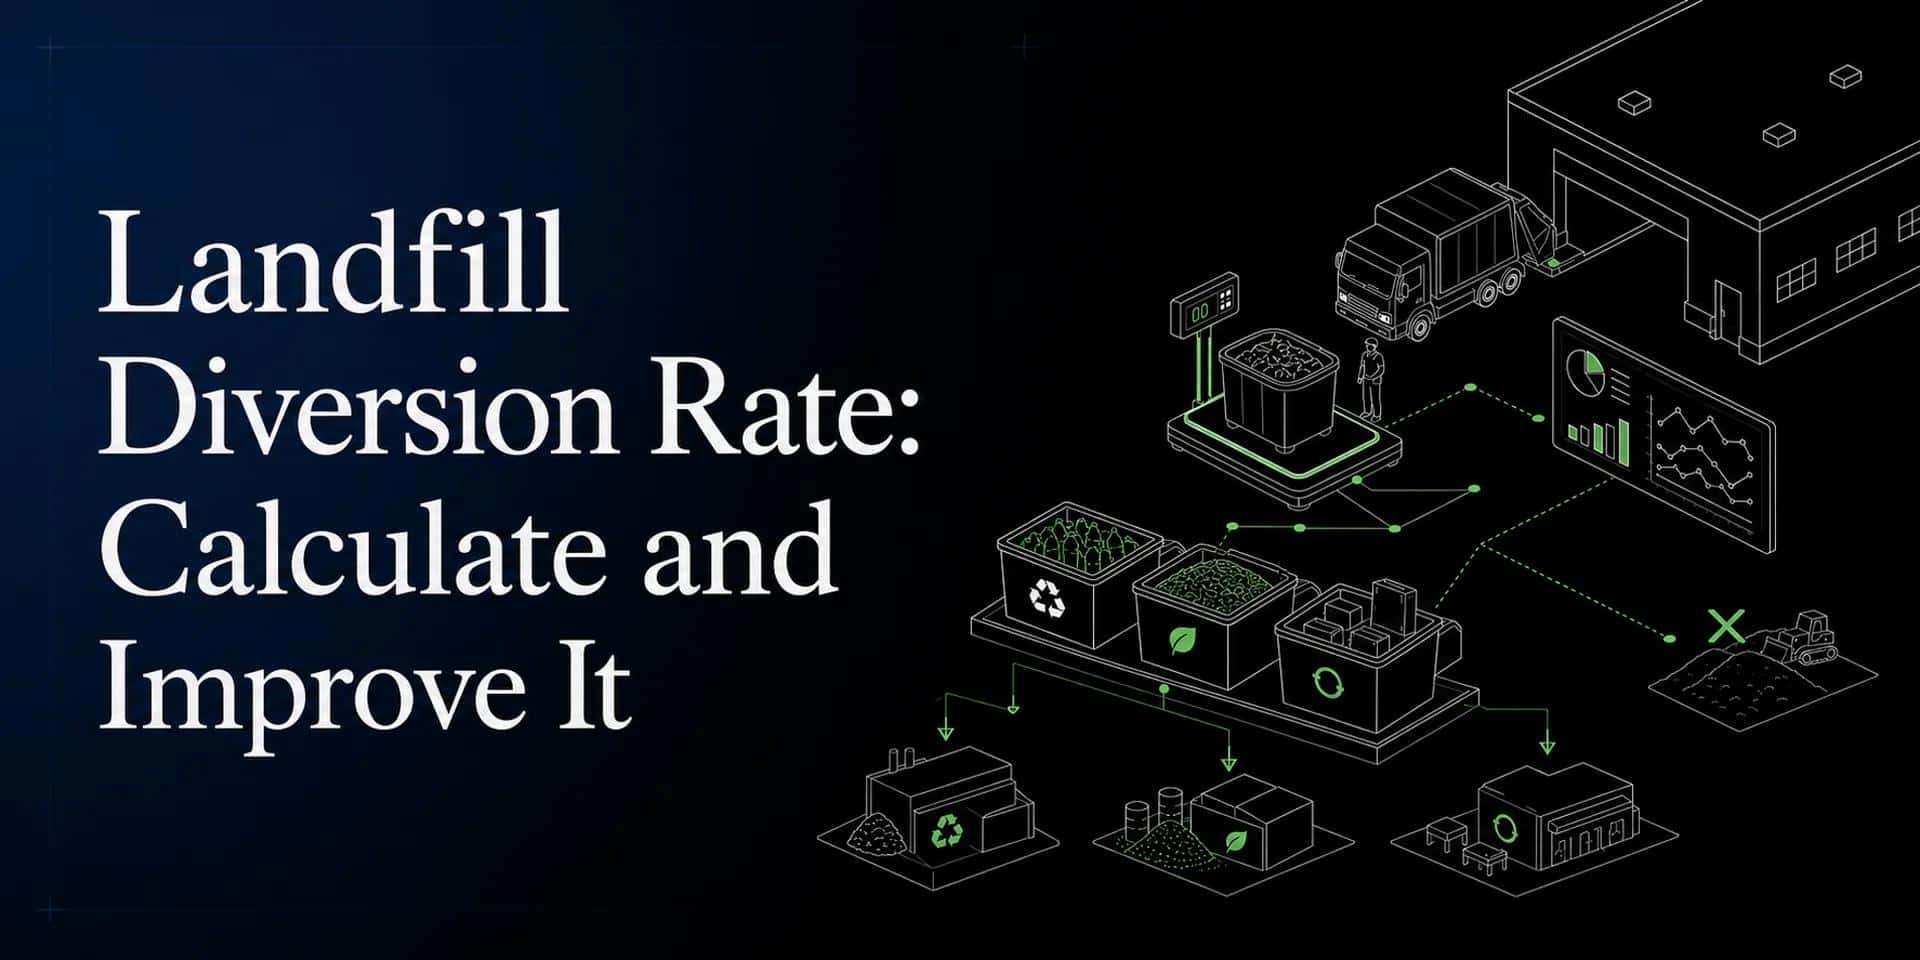
Reliable landfill diversion metrics depend on real weights rather than rough volume estimates.
A landfill diversion rate is the share of total waste that a site keeps out of landfills through recycling, composting, or reuse. To find this number, you must divide the total weight of diverted waste by the total weight of all waste produced and then multiply by one hundred. Using the standard rules set by theEPA, firms can track the success of their sustainability programs and meet complex ESG reporting rules. While many firms rely on volume estimates, exact reporting needs real weights from certified scales to avoid wrong data. By tracking this rate, teams find ways to cut disposal costs and improve their impact on the earth. This data-driven plan ensures that every pound of waste is tracked from pickup to final reuse.
How to calculate your landfill diversion rate
Thelandfill diversion rateshows how much waste your business keeps out of landfills. It tracks the success of your recycling and composting programs. By knowing this number, you can better meet your goals forwhat is landfill diversionand ESG reporting. It turns waste data into a clear sign of progress for your team. This metric is a key part of modern sustainability logistics for large firms.
The standard rule
To find your rate, you need to know two main numbers. First, you need the weight of all waste you save from the landfill. Second, you need the total weight of all waste your site makes in a set time. TheEPA uses a standard ruleto find this rate. You divide the weight of saved waste by the total weight of waste made. Then, you multiply that number by 100 to get a percent.
It is vital to know what counts as diverted waste. This group includes all items that go to a recycling center or a compost site. It also includes items you reuse at your facility. Total waste made is the sum of everything your site creates. This means you add the items you save to the items you send to the dump. Using this mass balance plan helps you keep track of every pound of waste.
- Collect weights for saved items.You must track the weight of everything you recycle or compost. This includes common items like paper, metal, and glass. It also covers food waste and e-waste. Do not use guesses for these figures. Real data starts with real weights.
- Track weight for trash.Record the weight of everything sent to the landfill. This is your disposed waste. It is the material that does not go to a recovery site. Your waste hauler should give you these weights for each pickup.
- Find the total weight made.Add your saved weight and your trash weight together. This sum represents the total weight of waste your business created. Most firms track this for a month or a full year. This total is the base for all your waste math.
- Divide the two weights.Take the weight of your saved waste. Divide it by the total weight made. This shows the part of your waste stream that was saved. The result will be a decimal number between zero and one.
- Turn the number into a percent.Multiply the result by 100. This final number is your diversion rate. A higher percent means you are keeping more items out of the landfill. Many firms aim for a rate of 75 percent or more to meet federal goals.
Reporting with clear data
Enterprise firms need data they can trust for their reports. To keep things steady, you shouldreport all your data in tons. You should also track your waste on a calendar year basis. This makes it easy to compare your success from year to year. Using tons ensures your data fits with standard rules for your industry across North America.
Many waste haulers use guesses to find weights. This often leads to data that is not right. For true ESG reporting, you need weights from state-certified scales. This is how CheckSammy finds its 94% average diversion rate. Real weights from real scales give you an auditable chain of custody. This keeps your data clear and ready for any review by leaders.
Clear reporting also helps you find ways to save money. When you know exactly how much waste you make, you can pick the right tools and staff. You can see which sites are doing well and which ones need help. This data-forward plan turns waste management into a tool for business growth and better facility care.
Which material streams belong in the calculation?
Core recycling and organic streams
Complex enterprise waste types
- Standard Recyclables:Diversion Type:Recycling;Calculation Rule:Include full weight of sorted paper, plastic, and metal.
- Organic Material:Diversion Type:Composting;Calculation Rule:Track weight of food scraps and yard waste sent for rot.
- E-Waste and ITAD:Diversion Type:Asset Recovery;Calculation Rule:Count weight of devices sent for part reuse or scrap.
- Construction Debris:Diversion Type:Material Reuse;Calculation Rule:Include concrete, wood, and metal kept out of the dump.
- Donated Goods:Diversion Type:Reuse;Calculation Rule:Track weight of items given to charities or schools.
What to exclude from your math
How to prevent data gaps
How can diversion estimates become misleading?
Yourlandfill diversion rateis a vital sign for your sustainability plan. But if the data behind that rate is flawed, your reports may not show the truth. Many firms rely on guesses rather than hard facts. This leads to gaps in reporting and can put your ESG goals at risk. To get clear results, you must know where these errors start.
The risk of volume estimates
The most common error in waste data comes from how we measure material. Many waste haulers use volume-to-weight estimates. They guess the weight based on how full a bin looks. This way is often wrong because it does not count the density of the waste. A bin full of cardboard weighs much less than a bin full of glass. If your hauler guesses the same weight for both, your data will be wrong. Using these guesses leads to wrong data and poor reports.
TheEPA suggests using weightto keep data the same. When you rely on volume, you may over-count your success. CheckSammy avoids this by using state-certified scales for every load. This ensures your data comes from real weights, not rough guesses. Using exact numbers is the only way to ensuretracking sustainability outcomesstays accurate for your business. Certified scales give you a solid base for your annual reports.
Reporting gaps and boundaries
Where you draw the line for your data is as vital as how you measure it. Some firms use selective boundaries to make their rates look better. They might only count the waste from their main office while ignoring large warehouses or factories. This creates a false view of the total waste made by your company. A truelandfill diversion ratemust count all solid waste made by the system. This follows therules for waste generationwhich say you must count all waste produced.
Time frames also play a big part in data gaps. Some vendors report on different cycles, like monthly or every few months. The EPA suggests that firmsget data on a year basisto keep things the same. Without a set time frame, you cannot compare your progress year over year. You might also face double counting if you send waste to a middle site that counts the material twice. Clear chain-of-custody tracking stops these issues. It follows material from the point of pickup to the final site where it is saved.
Contamination and material loss
Contamination is another way that guesses fail. A bin might be marked as recycled on the dock, but it could be full of trash or wet food. If a load has too much food waste or dirt, the center may reject it. That material then goes to a landfill. If your report only looks at what left your site, your diversion rate will be too high. You need proof that the material was truly saved and not just hauled away to a dump.
Material sent for reuse without proof is just a hope, not a fact. Many vendors give vendor averages based on their whole fleet of trucks. These numbers do not show what happens at your own sites. To know your true impact, you must understandwhat is landfill diversionin a real, auditable way. This means getting proof of where the load went. This proof shows that your waste was saved as promised. Detailed tracking shows you exactly how much material stayed out of the landfill.
Why certified scale weights improve reporting accuracy
Many firms rely on volume guesses to track their waste. They look at a bin and guess how full it is. This method is often wrong. It does not account for how much items weigh or how tightly they are packed. If you want a real landfill diversion rate, you need a better way. Using proven scale weights removes this doubt. It gives you a precise look at your waste stream. This data is the base of a real report.
When you use weights instead of guesses, your data becomes solid. This is vital for firms that need to meet strict green goals. Solid data helps you see exactly where you can improve. It also ensures that your public claims match the truth of your work. Proven weights turn a guess into a hard fact. This is the first step toward better results for your team and the planet.
Why volume guesses fail
Volume tracking has many gaps. A bin full of loose plastic looks the same as one full of heavy glass. But the weights are very different. If you only track volume, you might think you are recycling more than you really are. This makes it hard to find your true landfill diversion rate. It can lead to slips in your yearly reports and ESG filings.
Most haulers use these guesses because they are fast. But fast data is rarely good data. If you want to know thebenefits of landfill diversionfor your firm, you must know the mass. Weight is a stable metric. It does not change based on how someone stacks a bin. It is the best way to track waste across the world today.
The role of state-certified scales
State-certified scales are tools tested by the law. They must be right to be used in trade. When a truck rolls over these scales, the weight is logged with high precision. This data is much better than a driver's quick guess. It gives you a clear audit trail from the start to the end. It ensures that every pound is tracked in your records.
Using these scales helps you hit high marks. For example, federal groups must reach a 75 percent rate by 2030 underExecutive Order 14057. Without precise weights, reaching that goal is very hard to prove. CheckSammy uses these scales to help partners reach an average rate of 94 percent. This shows that real data leads to better outcomes for everyone.
Creating an auditable chain of custody
Being right is about more than just numbers. It is about proof. An auditable chain of custody shows where every pound of waste goes. This starts with a weight from a certified scale. It ends with a record from the site that took the load. This loop of data is howtracking sustainability outcomeshappens for big firms.
When you have these records, you can answer tough questions from leaders. You can show exactly how much waste was diverted and how it was done. You do not have to worry about a mistake in a volume guess. These records build your brand's trust. They show that you are a leader in your field. High-quality data is the best way to prove your impact on the world.
How to improve your landfill diversion rate
To boost your landfill diversion rate, you need a plan that works for all your sites. It is more than just putting out blue bins. You must track how waste moves from the moment it is made to its final stop. A high rate shows you are good at keeping waste out of the dump. It also proves your firm is a leader in green goals.
CheckSammy has helped many firms move over 175 million pounds of waste. We have seen that the best plans rely on data, not guesses. By following a clear path, you can lower costs and help the planet. Here is how to build that path for your firm.
Audit your waste streams
You must know what you are throwing away before you can change it. Many firms do not have a clear view of their waste streams. They might know they have a lot of trash, but they do not know what is in it. A waste audit is the best way to find out what you really have in your bins.
During an audit, you look at every bag of trash. You see how much of it is paper, plastic, or food. This helps you find quick wins. For example, you might find that most of your waste is cardboard. If you recycle that, your rate goes up fast. This is a simple way to start your plan and see results.
Good metrics rely on proven weights rather than volume guesses. Volume guesses often lead to bad data and wrong reports. This can make it hard to see your true impact. Using official scales ensures your audit is true. It gives you a base you can trust as you set new goals.
A roadmap for better diversion
A roadmap gives your team a clear guide to follow. It helps you stay on track as you grow. Enterprise firms face unique issues when trying to boost their rate. They have more sites, more staff, and more types of waste. A roadmap helps solve these issues by giving each site a script to follow.
It also helps you spot which sites are doing well and which need more help. Large firms with many sites need this the most. It keeps everyone working toward the same goal. Follow these steps to reach your green targets and improve your results.
- Set a baseline. You need to know where you are starting. Weigh every pound of waste for at least one month. This gives you a clear number to beat as you move forward.
- Find your top streams. Look for the materials you make the most of. These are often things like paper, wood, or metal. Focus your work on these high-volume items first.
- Stop the mix. Mixing food or liquids with paper ruins the batch. Teach your team how to keep streams clean. This makes sure the waste can actually be reused.
- Use clear labels. People will not sort waste if it is hard to do. Put clear signs on every bin. Use colors and pictures so it is easy to see what goes where.
- Work with one team. Managing many waste firms is a mess. Combine your work with one partner who can handle all your sites. This makes your data much more clear.
- Aim high but be fair. Look at how others set goals. For instance, the EPA notes thatfederal groups must hit a 75 percent rateby 2030. Use this to help set your own targets.
- Check the data often. Do not wait until the end of the year to see your results. Watch your weights every week. This helps you catch problems before they hurt your rate.
Use tech for better results
Old ways of managing waste are slow and hard to track. You need a system that gives you data in real time. This lets you see if your plan is working. It also makes it easier to report your wins to your board. Good data is the key to real change in any large firm.
CheckSammy uses tech to sort complex streams at ZeroPoint Facilities. This lets us handle waste that others cannot. When you use tech-led moves, you get a full view of your waste from pickup to recovery. This tracking is vital for large firms that need to stay in line with rules.
Withgains of landfill diversionranging from lower costs to better brand trust, the right tech is a must. It helps you scale your wins across every site. Bytracking green resultswith data, you can prove your impact to leaders.
Frequently Asked Questions
How do you calculate diversion rate?
You find your diversion rate by dividing the weight of all diverted waste by the total weight of all waste produced. This total includes both trash and items like recycling or compost. Multiply the result by 100 to get the final percentage. Based on theEPA, this measure helps groups track how well they keep items out of landfills. Using real weights instead of volume guesses makes your data much more clear and exact.
What is the difference between diversion rate and recycling rate?
A recycling rate only counts items sent to a recycling plant. In contrast, a diversion rate includes all waste kept out of landfills. This includes recycling, composting, and items that are used again. Per theReworkSAtoolkit, diversion rate is a broader measure that shows a more complete picture of your green efforts. It helps firms see how much of their total waste stream is being put back into use rather than buried.
What is considered a zero waste to landfill diversion rate?
Most groups define "zero waste" as reaching a diversion rate of 90 percent or higher. This means only a small part of the waste stream goes to a landfill or is burned. Reaching this goal shows that a company has a strong plan for its waste. For example,CheckSammyhelps firms hit high rates by sorting and moving complex waste paths through special hubs. This ensures that almost every pound of waste finds a new life instead of being dumped.
Is a high waste diversion rate good?
Yes, a high diversion rate is a key sign of a healthy waste plan. It shows that your business is keeping most of its waste out of landfills and put back into use. High rates help companies meet their green goals and can lower costs. For example, federal agencies must aim for a 75 percent diversion rate by 2030 underExecutive Order 14057. Tracking this measure helps you prove your impact to partners and customers.
Are you ready to cut costs and improve your diversion rate now?
Every day you wait to fix your diversion rate is one more day of paying too much while missing your firm's core green goals today. Poor waste data makes it hard to see where you can save cash every week, leading to lost profit and more trash in the dump. Booking a check of your waste streams right now gives you the facts you need to cut costs and show your progress to your board.
Are you ready to cut costs and improve your landfill diversion rate today?Request a landfill diversion assessmentto get a clear plan for your large firm and start saving on your waste stream now.