How to Reduce Recycling Contamination Across Locations
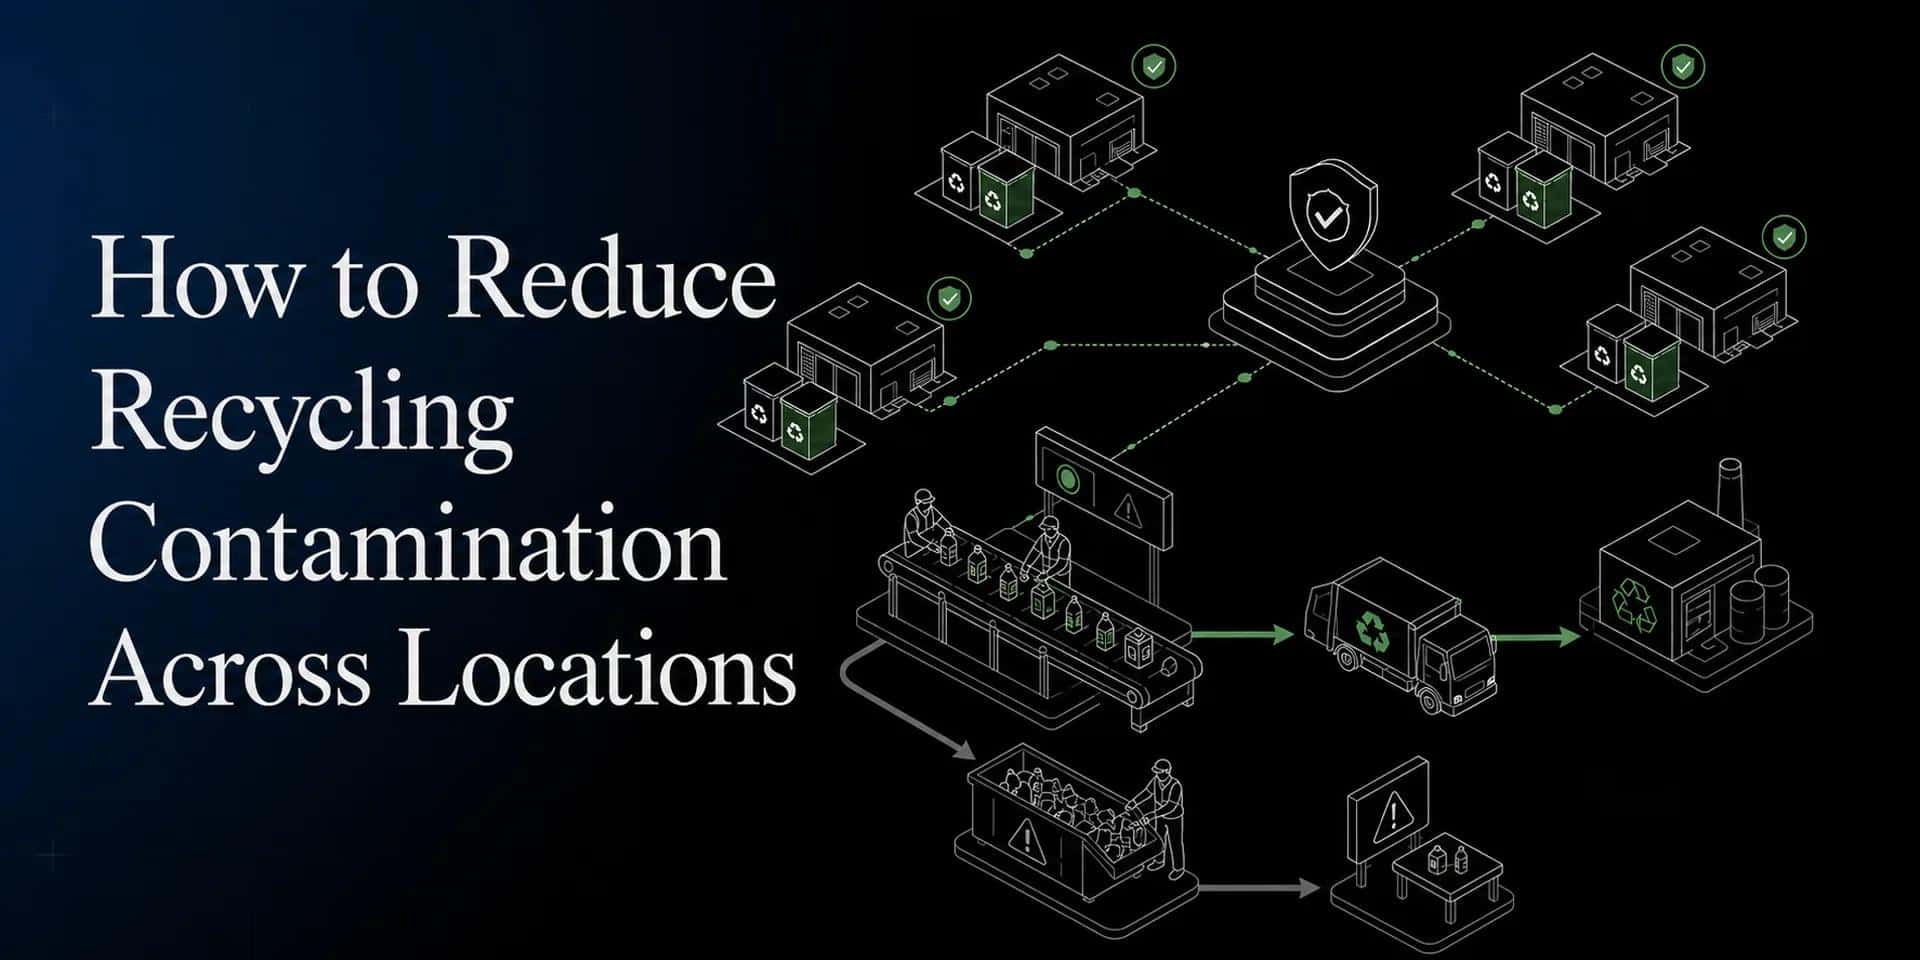
Enterprise operations lose thousands of dollars each year when contaminated recycling loads are diverted to local landfills. To reduce recycling contamination across dozens or hundreds of sites, multi-location businesses need standardized sorting, clear signage, and real-time data, not one-off fixes at individual facilities.
Get started with CheckSammy's enterprise recycling services today
What Is Recycling Contamination and Why Should Multi-Location Businesses Care?
To reduce recycling contamination, multi-location businesses standardize sorting, deploy clear signage, and track waste with real-time data across every site. Contamination happens when non-recyclable items mix with recyclables, which can force entire loads to landfill, inflate disposal fees, and distort ESG reporting. Regular audits and data pinpoint the hotspots to fix.
Recycling contamination occurs when people mix non-recyclable items with recyclables. This mix makes the entire load unviable for processing. For large firms, this is more than just a small error. It is a major operational risk. When a batch contains too many wrong items, it cannot be sorted. High rates ofrecycling contamination challengescan lead to entire loads being sent to landfills instead of being processed.
How contamination happens at scale
Confusion about which materials can be recycled is a major challenge for the U.S. municipal solid waste system. This issue grows when a company has many sites. Each city may have its own rules. Employees often do not know what is local and what is not. Common items like food residue, plastic bags, and non-recyclable plastics often end up in the wrong bin. According to theEPA, this confusion leads to lower quality in the recycling stream.
Food waste is one of the most common issues in commercial settings. A single unwashed container can ruin a whole bale of paper or cardboard. Once oil or food touches dry paper, that paper can no longer be sold. This lowers the value of all the waste you collect. It also means you pay to sort trash that was meant to be recycled.
The financial impact on your bottom line
Contamination carries real costs for both the environment and your operating budget. When loads go to a landfill, you lose diversion credit. Most haulers also charge higher fees for contaminated bins. These fees can add up fast across a national footprint. Reducing these errors can lead to increased diversion rates and lower disposal costs for your firm. It also makes your sustainability data more accurate for yearly reports.
Poor waste quality also hurts your ESG reporting. If your data shows high diversion but your loads end up in a dump, your reports are wrong. Clean streams provide a clear chain of custody. This helps you prove your impact to leadership and stakeholders. By fixing this issue now, you save money and protect your brand name.
How Do You Conduct Baseline Audits to Find Contamination Hotspots?
You cannot fix what you do not measure. For large firms, the first step toreduce recycling contaminationis to perform a waste audit. These audits help you find spots where your program fails. They show you exactly where non-trash items end up in the wrong bins. Modern waste streams change fast, and many systems cannot keep up with new types of trash. According to theEPA, our current infrastructure has not kept pace with these diverse material flows.
Identify Site Performance
An audit gives you a clear look at each location. You can see which sites follow the rules and which do not. This helps you move from reactive service to a proactive plan. By using data, you can optimize how you handle waste across all your buildings. Most experts suggest you run these checks at least once every three months. This regular pace helps you spot new red flags before they become big costs.
Turn Data Into Action
Once you have your audit results, you must act on them. Look for trends like food waste in paper bins or plastic bags in cardboard loads. These hotspots tell you where you need better signs or more staff training. Data visibility is key to holding each site accountable for its waste. Use these steps to set up your first audit cycle.
Sort the waste into groups like clean paper, plastics, glass, and actual trash. Weigh each group to find your exactwaste auditsmetrics.
Check for items that should not be there, such as liquid containers or greasy food wraps. Note which items show up most often as mistakes.
Log your findings in a central database to compare sites. This lets you see which managers need more help or better tools.
Set a new goal for each site based on its current rate. Use this baseline to track how much you improve over the next year.
How Do You Build a Standardized Signage and Training Program?
Consistency is the key to success when managing waste across many sites. A lack of clear rules often leads to confusion about which items go in which bin. This confusion is a top reason why recycling streams fail. By using the same signs and training at every site, you canreduce recycling contaminationand keep your material streams clean.
Design image based signage
Good signs show people exactly what to do without using too many words. Use clear pictures of the actual items your staff handles every day. These pictures help workers sort waste quickly and correctly. Since modern waste streams are complex, signs must be easy to read at a glance. TheEnvironmental Protection Agency(EPA) notes that confusion about what to recycle is a major hurdle for waste systems today. Clear images help solve this problem.
Your signs should be in the same spot at every location. Use bright colors to mark different bins, like blue for paper and green for glass. Make sure these colors do not change from one building to the next. This helps staff build habits that work no matter which facility they are in. When the look of your program stays the same, people are more likely to follow the rules.
Set up staff training cycles
Signs alone are not enough to keep your bins clean. Your team needs regular training to understand why sorting matters. Teach new hires about your waste goals during their first week on the job. Explain which materials your local haulers accept and which ones they do not. This step is vital because local rules can vary, and staff must know how to handle the specific waste your business creates.
Do not stop with new hires. Run annual refreshers for all staff to keep the rules fresh in their minds. Use these meetings to talk about common sorting errors or new types of packaging. Short, frequent talks are often better than one long meeting. They keep the topic top of mind without taking too much time away from daily tasks. Regular checks help you find and fix errors before they become big issues.
Audit for program compliance
Even the best program needs regular checks to stay on track. Visit your sites to see if staff members are using the bins correctly. Check if signs are still in place and easy to see. These audits give you real data on how well your training works. If you find one site is struggling, you can give them extra help or update their signs. This proactive approach keeps your program strong across your entire footprint.
How Should You Position Bins and Infrastructure at Each Location?
Toreduce recycling contamination, you must look at how your staff uses bins each day. Poor bin layout leads to "wishcycling." This is when people toss items into any bin they see. This often starts with a lack of nearby options or poor labels. By placing the right bins in high-traffic spots, you make clean recycling the easiest choice for your team.
Match bin kits to specific facility needs
Each type of site needs a different set of bins to work well. An office might only need bins for paper and cans. A warehouse needs space for stretch wrap and pallets. Retail stores often deal with mixed plastics and food waste from breakrooms. Using a set bin kit for each site format helps you keepuniform operational standardsacross your national footprint. This helps a worker moving from one site to another know where to put waste.
Position bins near material source points
Bins should sit as close to where waste is made as possible. If a worker has to walk across a large floor to find a recycling bin, they may use a trash can instead. In shipping areas, place bins for film and cardboard right next to packing desks. In breakrooms, keep food waste bins separate to avoid leaks. Food residue and non-recyclable plastics are themost common contaminantsin commercial waste streams. Good placement keeps these items from ruining a clean load.
Use data to fix infrastructure gaps
If one site has high contamination, your bin layout may be the cause. Real-time data lets youtrack contamination datadown to the specific facility or bin. If a certain bin is always full of the wrong items, it might need better signs. Confusion about which items are recyclable is amajor challenge for the U.S. recycling system. Using data to spot these spots of confusion helps you adjust your setup before it hurts your diversion rates.
The case for a unified vendor standard
Multi-location businesses achieve the best contamination outcomes when every site operates under the same vendor requirements. That means a single set of contamination limits, the same documentation requirements, and consistent pricing regardless of geography. A network ofrecycling serviceswith 10,000+ vetted professionals and nationwide coverage provides the scale to enforce this uniformity across North America.
- Each site negotiates its own contamination thresholds:Unified Vendor Standard:One enforced standard across all locations
- No visibility into diversion outcomes:Unified Vendor Standard:Auditable chain of custody from pickup to disposition
- Inconsistent pricing and service quality:Unified Vendor Standard:Flat national pricing with predictable costs
- Contamination data stays with the hauler:Unified Vendor Standard:Real-time tracking and verified reporting
- Diversion rates estimated, not measured:Unified Vendor Standard:94% average diversion rate verified by certified scales
Chain of custody as a contamination-control tool
Auditable chain-of-custody tracking ensures that materials picked up are actually diverted from landfills. Real-time tracking from pickup to disposition, supported by state-certified scale data, gives operators confidence that their contamination-reduction efforts produce real outcomes. When a load is rejected, the chain of custody shows exactly where and why, enabling corrective action at the originating site.
How Can Real-Time Data Track and Improve Contamination Performance?
Real-time data visibility transforms contamination management from reactive to proactive. Instead of waiting for quarterly audit results, operators can see contamination rates by site, by material stream, and even by individual bin.
Build location-level dashboards
The most effective programs track contamination at the site level. A dashboard that shows each location's contamination rate, diversion rate, and cost per ton rejected gives facility managers a clear target. When one site's contamination rate spikes, the team can respond immediately rather than discovering the problem months later during an audit.
Data visibility allows operations teams to pinpoint specific facilities or bins that are contributing to high contamination rates. This level of granularity turns contamination from a vague operational concern into a measurable, manageable metric. It also connectstracked contamination datawith the systems that executives already use for ESG reporting.
Use trend data to target interventions
Contamination patterns are rarely random. A site that consistently shows high levels of food waste in paper recycling likely needs better breakroom signage. A warehouse with plastic bags in the cardboard compactor may need a dedicated film recycling station. The data shows you where to spend your training and infrastructure budget for the highest return.
Better contamination management directly improves the accuracy of ESG and sustainability reporting. Cleaner material streams mean the diversion numbers in your annual report reflect real outcomes, not assumptions.EPA-aligned carbon calculationsbuilt on verified data give stakeholders confidence in the reported impact.
Essential KPIs for multi-location contamination management
The most useful metrics operate at the site level so that every facility manager has a clear, actionable target. Portfolio-level averages can hide underperforming locations.
- Contamination rate per location:The percentage of non-recyclable material found in recycling streams at each site. Baseline this number through an initial audit, then track monthly.
- Diversion rate:The percentage of total waste material diverted from landfill. As contamination drops, diversion should rise.
- Cost per ton rejected:The financial impact of contaminated loads, including hauling fees, landfill tipping fees, and lost diversion credit. This metric connects contamination directly to P&L.
- Training completion rate:The percentage of staff who have completed onboarding and annual refresher training. Low completion rates are a leading indicator of contamination problems.
- Audit frequency:The number of waste audits completed per site per quarter. Regular audits catch problems early and reinforce accountability.
Quarterly review cycle
Contamination trends take time to develop, and overreacting to single-month anomalies is counterproductive. A quarterly review cycle is the right cadence for most multi-location programs. Each quarter, compare each site's metrics against its baseline, identify facilities that improved or regressed, and adjust training or infrastructure allocations accordingly.
When contamination at a site exceeds a defined threshold two quarters in a row, escalate to corrective action. This may involve on-site retraining, infrastructure changes, or vendor reassignment. The key is having the escalation path definedbeforeit is needed.
The financial case for continuous improvement
Organizations that invest in contamination reduction see measurable returns. Reducing contamination increases diversion rates and lowers disposal costs. Enterprise organizations can achieve a 30-40% cost reduction compared with traditional waste haulers when they pair clean material streams with a unifiedrecycling servicesplatform.
Tech-supported tracking ensures accountability across every site in the network. When each location knows its performance is being measured against the same standard and visible to leadership. Contamination reduction becomes a shared operational goal rather than an environmental aspiration.
Frequently Asked Questions
How can businesses reduce recycling contamination?
Companies can cut recycling contamination by doing waste audits to find problem areas. Using clear, image-based signs on all bins helps employees sort waste the right way. Giving regular training on local recycling rules also ensures that staff know which items are allowed. These simple steps create a strong base for cleaner waste streams across every site in your network.
What items cause the most recycling contamination in business programs?
The most common items that ruin business recycling are food waste, liquids, and plastic bags. Plastic bags are very harmful because they can tangle in sorting machines. Other issues include non-recyclable plastic types and toxic waste. According to theEPA, confusion about which items are allowed is a major challenge for the national recycling system.
How do multi-location firms maintain recycling quality across all sites?
Multi-location firms keep high standards by using the same rules at every site. This includes using the same bin labels and tracking tools across the country. Real-time data views allow teams to see which specific sites or bins have the most issues. By fixing problems at the source, businesses can keep their recycling quality steady across their whole network.
What are the benefits of cutting recycling contamination for large firms?
Cutting contamination helps firms save money and reach their green goals. Clean recycling streams lead to more waste kept out of landfills and lower costs. In fact, better waste plans can help firms see a 30% to 40% cost reduction compared with traditional waste haulers, based on operational data from consolidated multi-location programs. Using data to track these wins also provides correct reporting for carbon impact goals.