How to Calculate Waste Diversion Rate for Your Organization
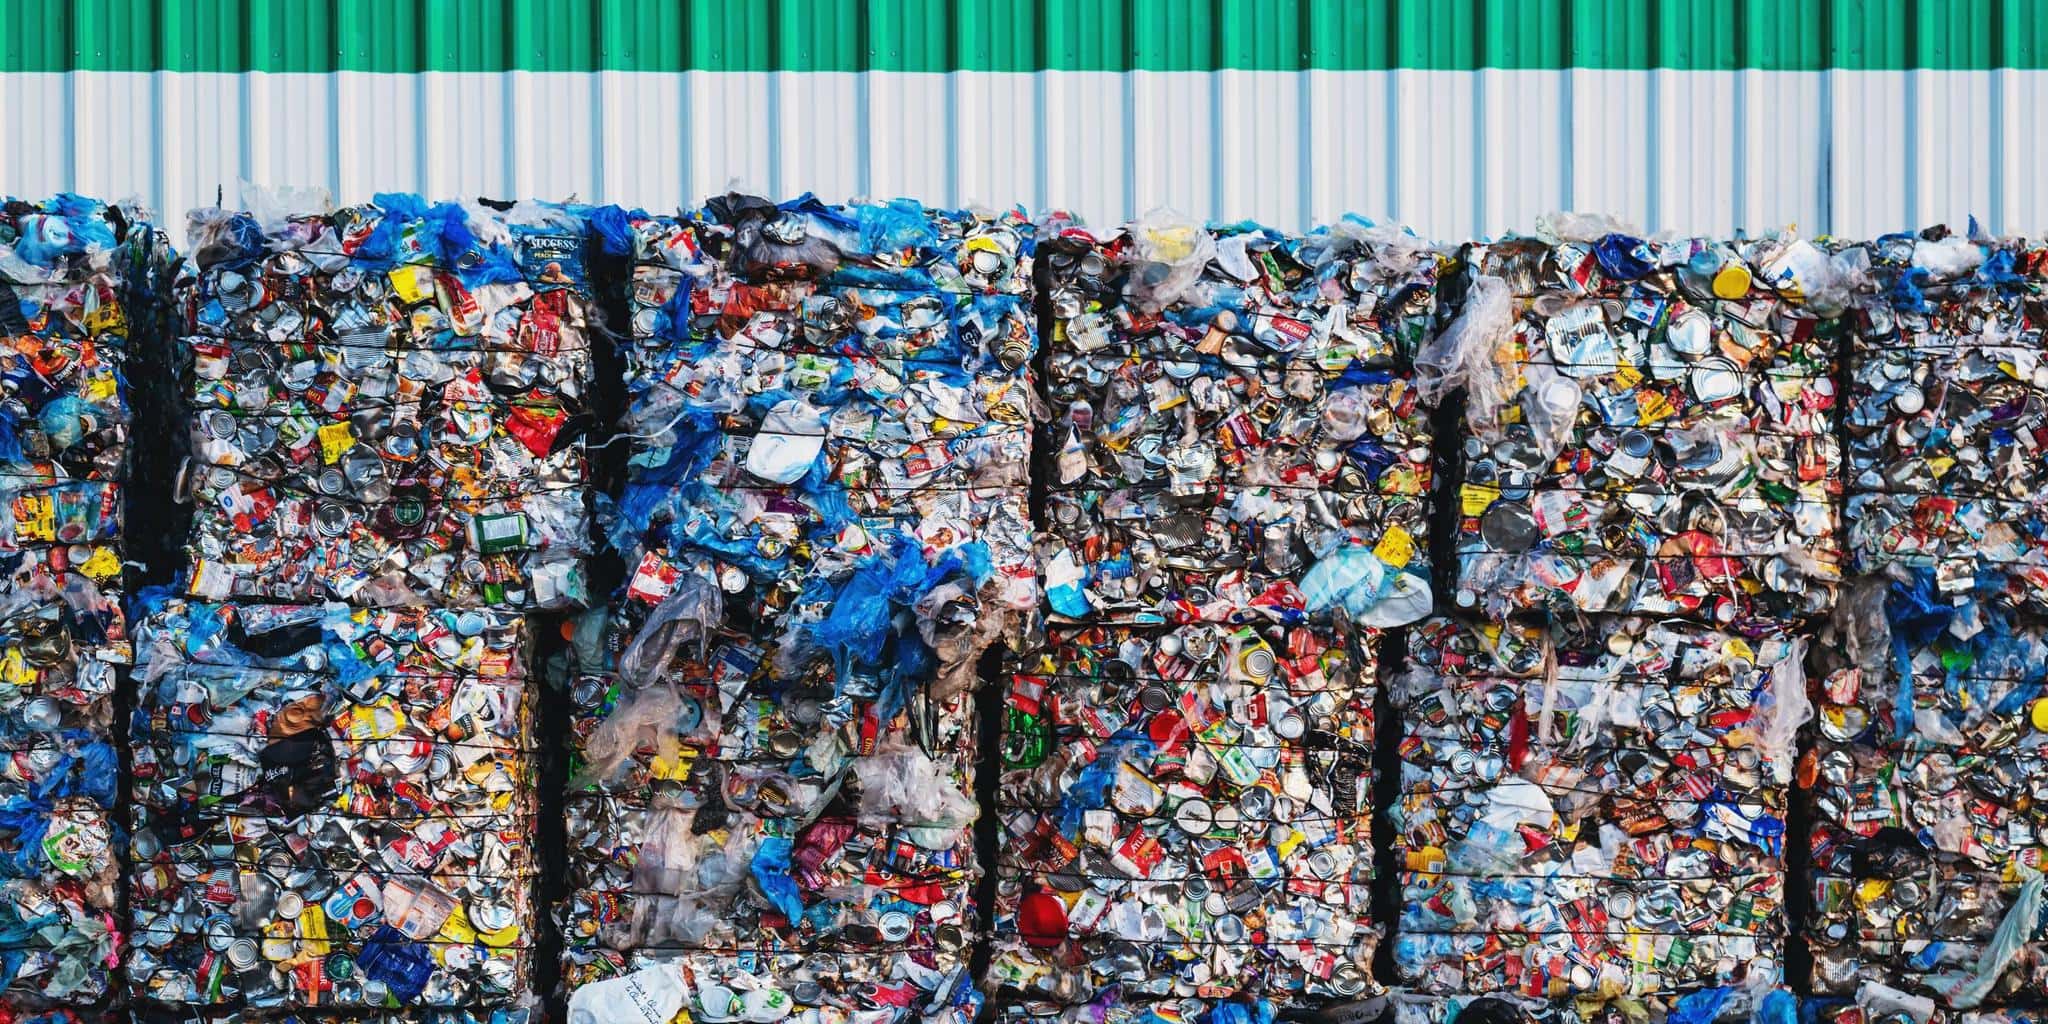
Vague waste estimates represent a material liability for facility directors and sustainability executives. Regulatory bodies, ESG rating agencies, and institutional investors increasingly demand auditable diversion data rather than self-reported approximations. Organizations that cannot produce verified diversion metrics risk compliance gaps, reputational exposure, and missed cost-reduction opportunities.
Request a consultation with CheckSammy to learn how state-certified scale data and real-time tracking can transform your diversion reporting from estimates into auditable evidence.
How to calculate waste diversion rate for your organization requires a straightforward weight-based formula: divide the total weight of all diverted materials (recycling. Compost, reuse) by the total weight of all waste generated, then multiply by 100. For multi-site enterprises, the calculation depends on consistent data standards, verified scale weights, and accurate categorization of material streams. CheckSammy achieves an average 94% diversion rate across client facilities using state-certified scales and real-time chain-of-custody tracking that eliminates estimation errors common with traditional hauler billing data.
How To Calculate Waste Diversion Rate: What Is Waste Diversion Rate and Why Does It Matter for Enterprise Reporting?.
A waste diversion rate quantifies the percentage of total generated waste that is diverted from landfill disposal through recycling, composting, reuse, or other recovery pathways. This metric serves as a core KPI for corporate sustainability reporting, ESG compliance frameworks such as GRI and SASB, and regulatory programs requiring measurable waste reduction targets. Accurate diversion rates require precise weight-based data rather than volumetric estimates.
For enterprise organizations, the diversion rate functions as a quantitative indicator of operational efficiency in materials management. It reveals how effectively a facility separates recyclable and compostable materials from landfill-bound waste and identifies opportunities for program improvement. The U.S. Environmental Protection Agency (EPA) defines diversion as materials diverted from landfill incineration, forming the basis for most regulatory and voluntary reporting frameworks.
Material streams commonly tracked in enterprise diversion programs include:
- Cardboard, mixed paper, and office paper for recycling.
- Glass, aluminum, and rigid plastic containers.
- Organic waste streams including pre- and post-consumer food scraps.
- Scrap metal, wood pallets, and construction debris.
- Electronic waste through certified ITAD processors.
ESG Reporting and Investor Expectations.
Institutional investors and ESG rating agencies evaluate corporate waste performance using standardized metrics. The GRI 306 Waste Standard requires organizations to report total waste generated, waste diverted from disposal, and waste directed to disposal. These disclosures must be supported by verifiable data collection methodologies. A verified diversion rate provides the quantitative foundation for these reports, reducing the risk of greenwashing allegations.
Enterprise sustainability teams must also consider the limitations of diversion rate as a singular metric. The aspects of sustainability that diversion rate cannot fully capture include transportation emissions, contamination rates, and downstream processing quality. A comprehensive ESG reporting framework supplements diversion data with these complementary metrics.
Industry Benchmark Standards.
A diversion rate exceeding 75% generally indicates a mature waste management program with effective source separation. Organizations like UW-Eau Claire and other institutional leaders have demonstrated that 75%+ diversion is achievable through comprehensive recycling, composting, and reuse initiatives. Top-performing enterprises target 90% or higher through advanced sorting infrastructure and vendor partnerships that access diverse end markets for recovered materials.
CheckSammy clients achieve an average 94% diversion rate through integration of ZeroPoint Facilities that sort, aggregate, and route complex material streams to verified recovery end markets. This infrastructure enables diversion outcomes that exceed industry baselines through data-driven operational precision rather than estimation.
What Is the Standard Formula for Calculating Waste Diversion Rate?.
The standard formula for calculating waste diversion rate is: (Weight of Diverted Materials / Total Weight of All Waste) x 100. Diverted materials include recycling, compost, and reuse streams. Total waste includes diverted materials plus landfill-bound waste. This weight-based calculation ensures accuracy superior to volume-based estimates commonly used in hauler billing data.
The calculation follows a precise mathematical structure standardized across sustainability reporting frameworks. As documented by the ReWorkSA toolkit, diversion rate = (D / T) x 100. Where D represents the combined weight of all diverted material streams and T represents the total weight of all waste generated by the facility or organization during the reporting period.
Step-by-Step Worked Example.
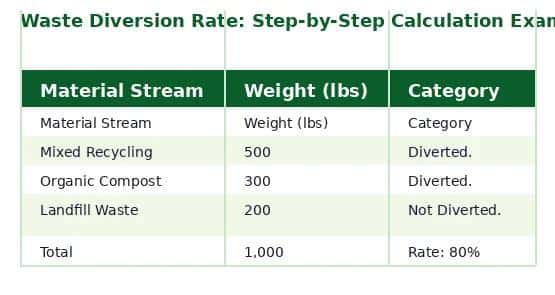
A mid-size corporate campus generating 1,000 pounds of total waste in a reporting period. With 500 pounds of recycling, 300 pounds of organics, and 200 pounds of landfill waste. Would calculate as follows: diverted weight = 500 + 300 = 800 pounds. Total weight = 500 + 300 + 200 = 1,000 pounds; diversion rate = 800 / 1,000 x 100 = 80 percent.
The following table provides a detailed breakdown of the calculation.
CheckSammy extends this methodology across multi-site portfolios by deploying automated sustainability reporting tools that aggregate verified scale data from each facility. This eliminates the manual calculation burden that typically limits diversion tracking to annual snapshots rather than continuous monitoring.
How Do You Collect Accurate Data for Diversion Calculations?.
Accurate diversion data collection requires weight-based measurement from certified scales, consistent material categorization across all sites, and auditable documentation through weigh tickets or digital records. Organizations should collect data for a minimum of three to six months to establish reliable baselines that account for seasonal operational variations.
Reliable diversion calculations depend on the quality and consistency of underlying data. Organizations cannot calculate accurate rates without implementing standardized measurement protocols across every facility in their portfolio. The primary data sources and their characteristics are described below.
Primary Data Sources for Diversion Metrics.
Enterprise organizations typically rely on the following data collection methods, ranked by reliability:
- Certified scale tickets: Weigh every load at state-certified scales, providing the highest accuracy for diversion calculations. Each ticket documents the exact net weight of material delivered to a processing or disposal facility.
- Hauler invoice data: Provides weight-based records when scale tickets are unavailable, though accuracy depends on the hauler's measurement equipment and reporting frequency. Many haulers provide estimated weights based on container volume and fill level rather than actual scale readings.
- Volume-to-weight conversions: Industry standard conversion factors approved by the EPA's volume-to-weight conversion guide allow organizations to estimate weight from container volume when direct measurement is unavailable. These conversions introduce estimation error and should be used only as a transitional method.
Conducting a professional waste audit for commercial facilities establishes baseline data on material composition and stream volumes. Audits reveal contamination issues, identify diversion opportunities, and validate the accuracy of ongoing data collection processes.
Standardizing Data Across Multi-Site Operations.
For organizations managing dozens or hundreds of facilities, data standardization represents the most significant operational challenge. Each site may contract with different haulers using different billing systems and material categorizations. Without standardized naming conventions for material streams and consistent measurement units, aggregate diversion calculations become unreliable.
Implementation of a centralized waste data management platform enables organizations to apply uniform categorization rules across all sites, regardless of local hauler variations. This infrastructure supports commercial recycling program management at enterprise scale by converting disparate data sources into a single, auditable reporting framework.
What Are the Most Common Challenges in Diversion Rate Calculation?.
The most common challenges in diversion rate calculation include contamination that invalidates diversion claims, inconsistent data standards across multiple facilities. Hauler estimation rather than actual scale weights, variable regional regulations defining diversion eligibility, and delayed reporting that prevents real-time program management. Each challenge requires specific mitigation strategies.
Enterprise sustainability teams encounter several structural barriers to accurate diversion calculation. Understanding these challenges is essential for implementing effective mitigation strategies.
Contamination and Data Integrity.
Material contamination occurs when non-recyclable or non-compostable items enter designated diversion streams. A recycling load containing more than 10-15 percent contamination may be rejected at the processing facility and redirected to landfill disposal. When this occurs without documentation, the diversion rate inaccurately reflects the load as diverted. Organizations must track rejection events and adjust diversion calculations accordingly.
Regular waste audits and employee training programs reduce contamination rates by improving source-separation accuracy. CheckSammy's operational model includes contamination monitoring at ZeroPoint Facilities where incoming loads are inspected and sorted before processing, ensuring that only verified clean materials count toward diversion metrics.
Jurisdictional Variability in Diversion Definitions.
Regulatory definitions of diversion vary significantly across municipal, state, and provincial jurisdictions. A material classified as diverted in one jurisdiction may be directed to landfill in another due to differences in local processing infrastructure or regulatory classification. Organizations operating across multiple jurisdictions must maintain location-specific diversion rate calculations that reflect local regulatory realities rather than applying a single national standard.
True diversion requires verified chain of custody documentation tracking each material load from generation through final disposition. This chain of custody constitutes the only defensible evidence for diversion claims in regulatory audits or ESG reporting reviews.
How Does Technology Improve the Accuracy of Diversion Calculations?.
Technology improves diversion calculation accuracy through real-time GPS tracking of collection vehicles, state-certified scale integration at processing facilities. Digital chain-of-custody documentation, and AI-powered data validation that identifies discrepancies in reported waste volumes. These technologies eliminate the estimation and delay inherent in traditional hauler-based reporting.
The transition from manual, hauler-dependent reporting to technology-enabled diversion tracking represents a fundamental improvement in data quality for enterprise sustainability programs.
Real-Time Weight Verification Systems.
State-certified scales integrated at processing facilities provide verified weight data for every material load. This infrastructure eliminates the estimation error inherent in volume-based billing and provides auditable documentation for each transaction. Weight data flows directly into centralized reporting platforms, reducing manual data entry and its associated error rates.
CheckSammy's operations utilize scale-verified weight data across its network of ZeroPoint Facilities, enabling an average 94% diversion rate with complete audit trail documentation. This data infrastructure supports real-time diversion tracking rather than the lagged, aggregate reporting typical of traditional waste service providers.
Digital Chain-of-Custody Tracking.
A comprehensive chain-of-custody system documents every material load from generation through final disposition. This system provides verifiable proof that materials counted as diverted actually reached legitimate recovery end markets rather than being redirected to landfill. For enterprise ESG reporting, chain-of-custody documentation transforms diversion claims from assertions into verifiable outcomes.
The CheckSammy technology platform provides complete chain-of-custody visibility through a centralized dashboard, enabling sustainability teams to monitor diversion performance across their entire portfolio in real time. This level of data transparency supports consistent facility services management across multi-location operations.
Best Practices for Tracking Diversion Rates Across Multi-Site Portfolios.
Best practices for enterprise diversion tracking include establishing standardized data collection protocols across all facilities, setting a verified weight-based baseline from at least 12 months of data. Conducting quarterly performance reviews, and implementing ongoing employee training programs with visual sorting guides to maintain low contamination rates.
Sustained diversion performance at enterprise scale requires systematic management practices that extend beyond initial program implementation. The following practices support consistent, verifiable diversion tracking across multi-site portfolios.
Establish Data Standardization Protocols.
All facilities must use identical material categorization definitions, measurement units, and reporting periods. A single taxonomy for material streams eliminates the aggregation errors that occur when sites use different naming conventions. The EPA's standardized data collection guidelines provide a framework for developing organization-specific protocols.
Implement Quarterly Performance Reviews.
Quarterly diversion rate reviews identify emerging issues before they compound into material reporting problems. A facility whose diversion rate declines from 80 percent to 72 percent over two consecutive quarters requires investigation and corrective action. Regular reviews distribute program management effort across the year rather than concentrating it in an annual reporting cycle.
The following checklist supports systematic multi-site diversion management:
- Define a single material classification taxonomy for all sites with clearly documented inclusion and exclusion criteria.
- Collect 12 consecutive months of verified weight data to establish a statistically reliable baseline.
- Deploy standardized visual sorting guides at every waste station across all facilities.
- Conduct quarterly data reviews comparing each site's current performance against its baseline diversion rate.
- Document corrective actions for any site showing two consecutive quarters of declining diversion performance.
Employee engagement represents a critical success factor for diversion program performance. Training programs that explain the operational and environmental rationale for source separation achieve higher compliance rates than programs that simply instruct. Clear visual signage at each waste station reduces contamination by providing immediate sorting guidance during daily operations.
How CheckSammy Delivers Verified Diversion Data at Enterprise Scale.
CheckSammy enables enterprise organizations to achieve verifiable diversion outcomes through state-certified scale data, real-time chain-of-custody tracking, and ZeroPoint Facility infrastructure that processes complex material streams. The platform transforms diversion calculation from an estimation exercise into a data-driven operational process with complete audit trail documentation.
Enterprise organizations seeking reliable diversion data face the structural challenge of coordinating measurement across diverse facilities, haulers, and regulatory jurisdictions. CheckSammy addresses this challenge through an integrated technology and operations model that delivers verified weight data for every material stream across the entire portfolio.
Schedule a consultation with CheckSammy to discuss how verified diversion data and real-time tracking can strengthen your organization's sustainability reporting and operational efficiency.
Verified Scale Data and Real-Time Monitoring.
CheckSammy's network of state-certified scales at ZeroPoint Facilities and collection points provides verified weight documentation for every load processed through the system. This data feeds into a centralized reporting platform that enables real-time diversion tracking across all client facilities. Organizations no longer wait weeks or months for hauler invoices to assess their diversion performance.
The combination of verified scale data and digital chain-of-custody tracking ensures that every pound of material is documented from generation through final disposition. This comprehensive data infrastructure supports operational efficiency improvements through waste audit analysis and provides the defensible data required for regulatory compliance and ESG reporting verification.
Across an operational network spanning more than 25,000 facilities and 10,000 vetted service professionals. CheckSammy delivers a 99.2 percent first-visit completion rate and less than 24-hour certificate delivery for documented diversion outcomes. This operational reliability enables enterprise organizations to maintain consistent diversion performance across their entire footprint while eliminating the administrative burden of hauler coordination and data reconciliation.
Frequently Asked Questions
What is the correct formula for calculating waste diversion rate?
The correct formula for waste diversion rate is the weight of diverted materials divided by the total weight of all waste generated, multiplied by 100. Diverted materials include recycling, composting, and reuse. Total waste includes all material streams: recycling, composting, organics, and landfill-bound waste. The formula requires weight-based data from certified scales for maximum accuracy.
What is a good waste diversion rate for a commercial organization?
A commercial organization with a mature diversion program typically achieves 75 percent or higher. Top-performing organizations reach 90 percent or above through comprehensive recycling, composting, and reuse programs combined with advanced sorting infrastructure. CheckSammy clients achieve an average 94 percent diversion rate through ZeroPoint Facility processing and verified scale data.
How do you calculate diversion rate when multiple facilities have different haulers?
Calculating diversion rate across facilities with different haulers requires standardized data collection protocols applied uniformly across all sites. Organizations must define consistent material categorization, measurement units, and reporting periods regardless of local hauler practices. A centralized data management platform that aggregates diverse hauler data into a unified reporting framework is essential for accurate multi-site diversion calculation.
What is the difference between waste diversion rate and recycling rate?
Waste diversion rate includes all materials diverted from landfill, encompassing recycling, composting, reuse, and other recovery pathways. Recycling rate specifically measures materials sent for recycling processing. Diversion rate is the broader metric and is the standard for ESG reporting frameworks including GRI and SASB because it captures the full scope of landfill avoidance activities.
How often should organizations calculate their waste diversion rate?
Organizations should calculate waste diversion rate at least quarterly for active program management. Monthly calculation is recommended for organizations with aggressive diversion targets or facilities undergoing program changes. Annual calculation alone is insufficient for identifying emerging contamination issues or operational problems that require timely intervention.
Ready to Move Beyond Estimated Diversion Rates?
Accurate diversion calculation requires verified weight data, standardized collection protocols, and complete chain-of-custody documentation. CheckSammy delivers these capabilities through an integrated technology and operations platform that transforms diversion tracking from a manual estimation exercise into an automated, auditable process.
Talk to our team about verified diversion tracking for your organization and learn how state-certified scale data, real-time monitoring, and ZeroPoint Facility infrastructure can support your sustainability reporting objectives.